Exploring my [exo]brain
— Albert De La Fuente VigliottiI really like working with graphs. I remember a project that I worked a while ago where I parsed the client requirements relationships into a graph and I could determine the priorities of modules development based on that. Good souvenirs. This original idea came from an analysis I did on my social networks out of curiosity and I could identify and find communities on graphs.
Now I am using org-roam as my notes management app. It is great and it works on top of org-mode and of course Emacs. Not everyone feels comfortable with this since it requires to be okay with technical bits and bytes. I just love it…
I started using v1.0 which did not supported to map org headings but only file top headers. This was brilliant already enough in itself. With v2.0 org-roam included the ability to map headers also. What was good became even better! The only caveat at that time is that org-roam-server stopped working. That is understandable. Now there is a new project called org-roam-ui which is basically org-roam-server for v2.0 with headings support.
Recently I trimmed my DB, I am trying to find a balance between using headings and not using headings. My Emacs default config used to creat UUIDs for each heading. This was good at first but I had to adapt this for org-roam v2.0… I had +9000 notes, which is unpractical to be honest… So I cleared the UUIDs of the headers of several files that were not needed and now I have +3000 notes. It is still too much IMO, so further trimming is needed but that cleanup needs more thought.
Now lets preview this thing… Most screenshots have been anonimized. At the time of this writing this is how my notes looks like. Keep in mind that out of all of my notes, only a few selected ones are shared here on my website.
I am going to show first a little video sample
Figure 1 is how the exobrain looks considering all notes
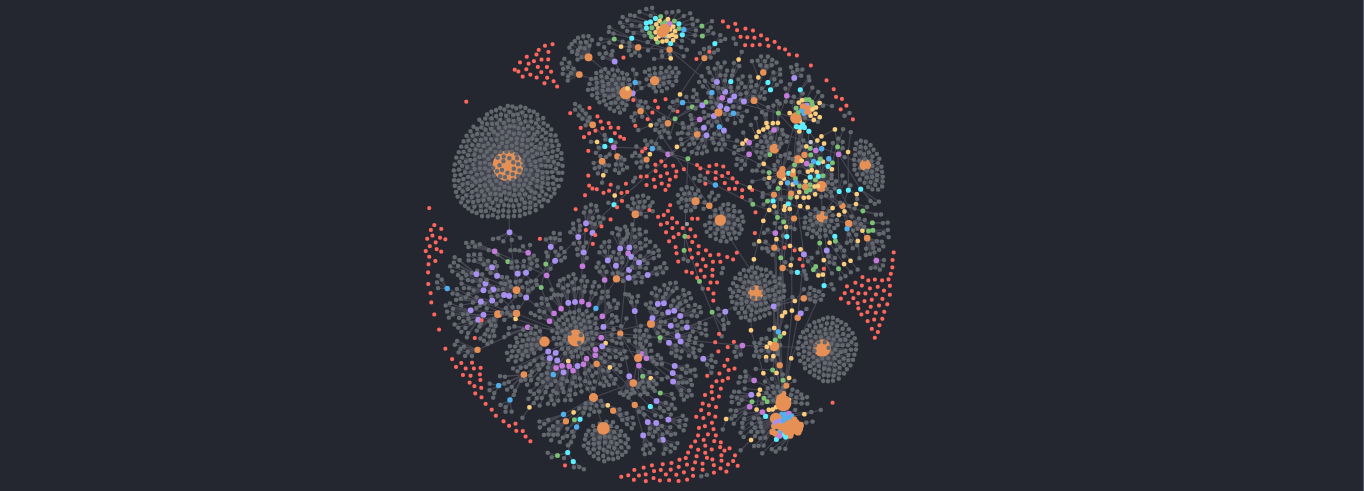
Figure 1: Exobrain with all headings and subheadings
Figure 2 is how the exobrain looks only considering the file headers and subheadings.
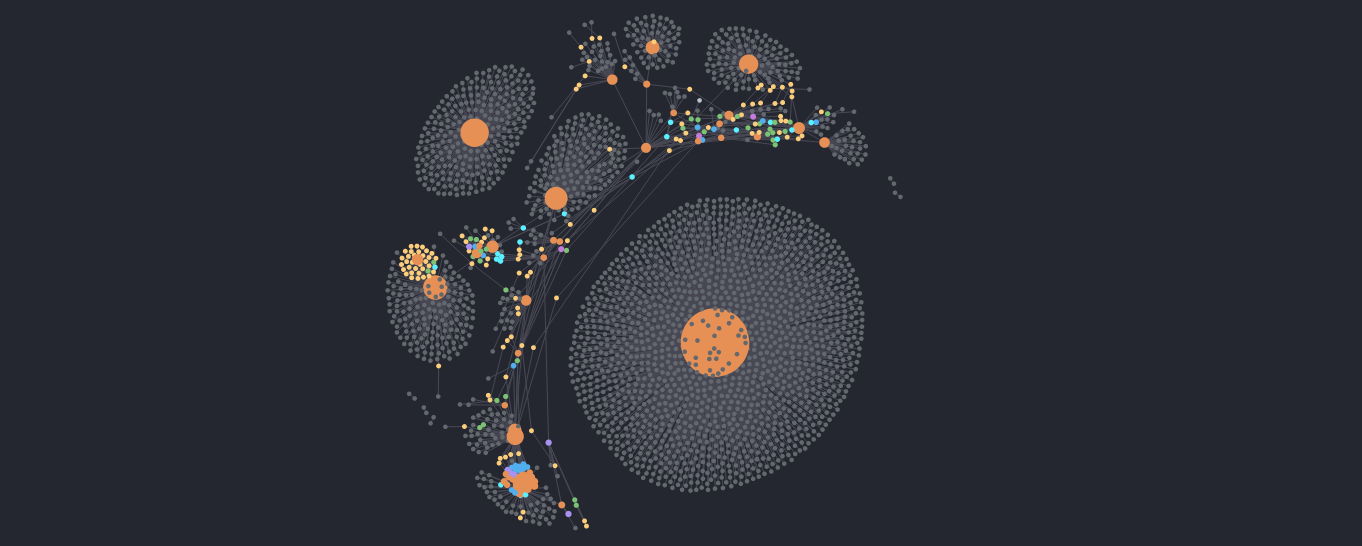
Figure 2: Exobrain with all headings and subheadings
Figure 2 shows my Emacs configuration file cluster and how it relates to other notes.
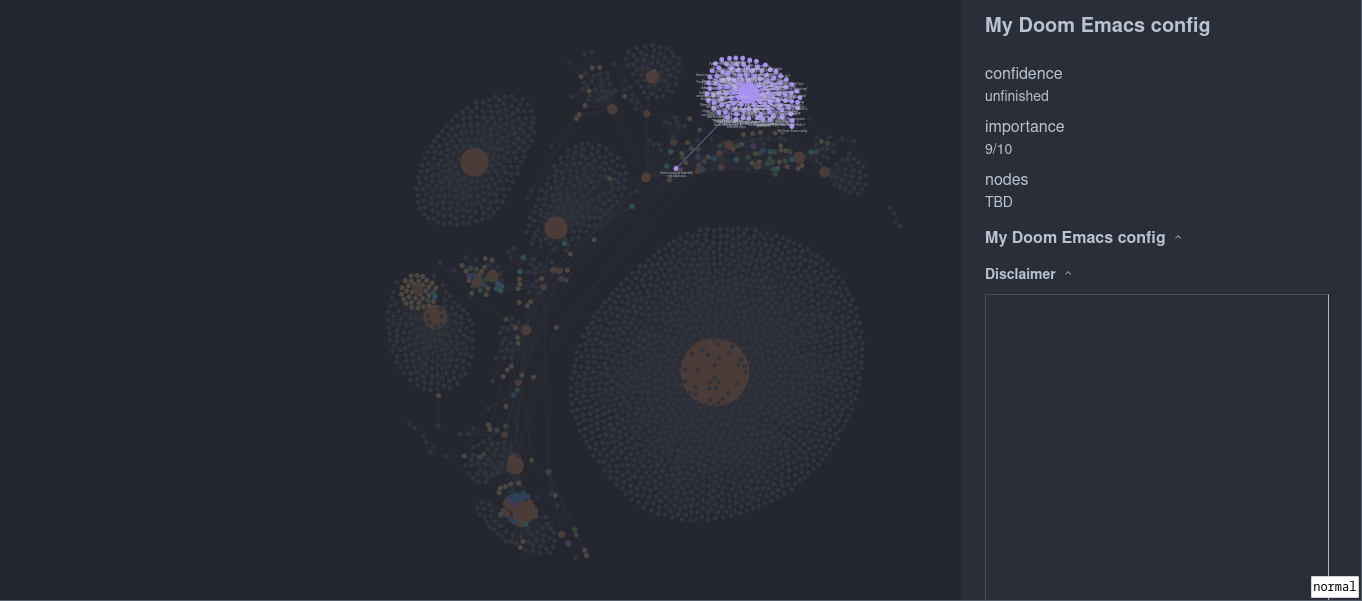
Figure 3: Exobrain highlighting Doom Emacs related notes
Figure 4 shows my parashot study notes.
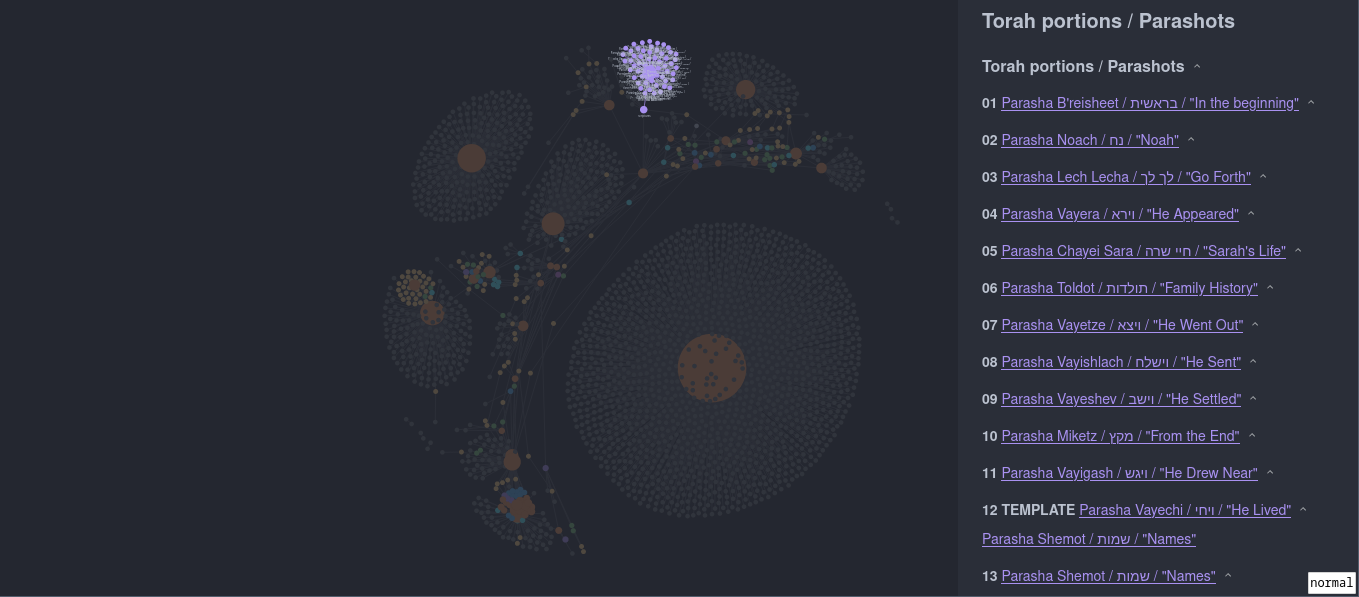
Figure 4: Exobrain highlighting the Torah parashot notes
Figure 5 shows my beekeeping notes and log, which is quite extensive by the way.
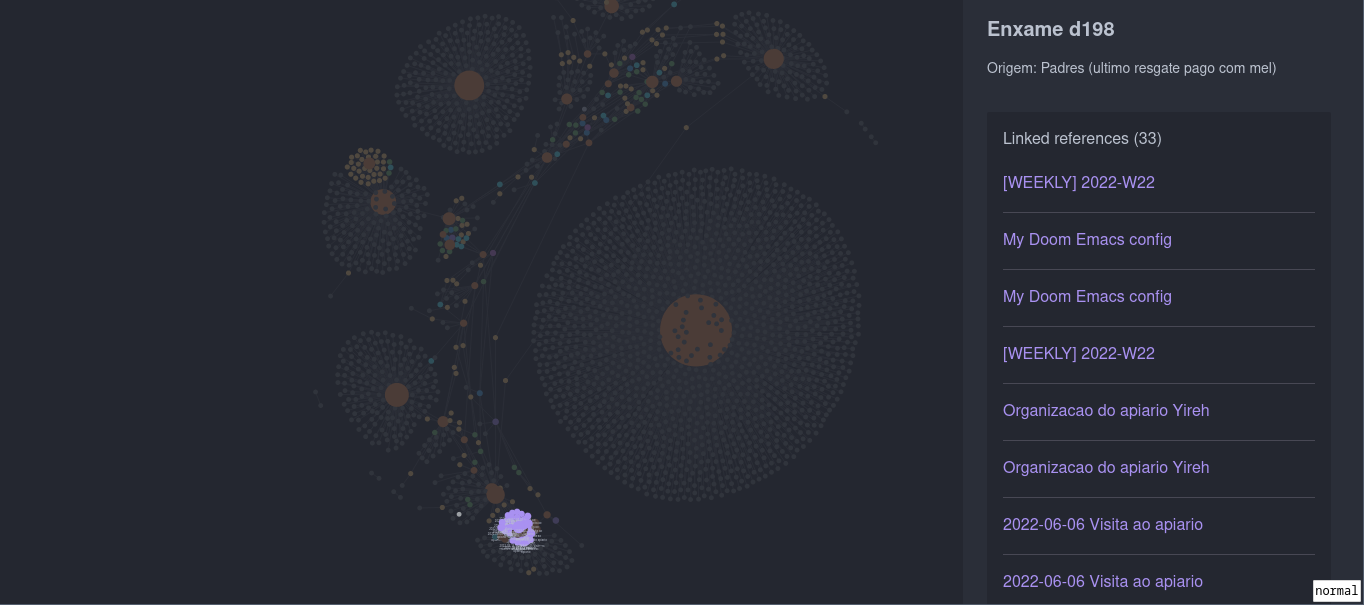
Figure 5: Exobrain highlighting the beekeping notes and logs
Figure 6 shows my testing trading notes. I developed my own tool to document my simulated tradings and tests.
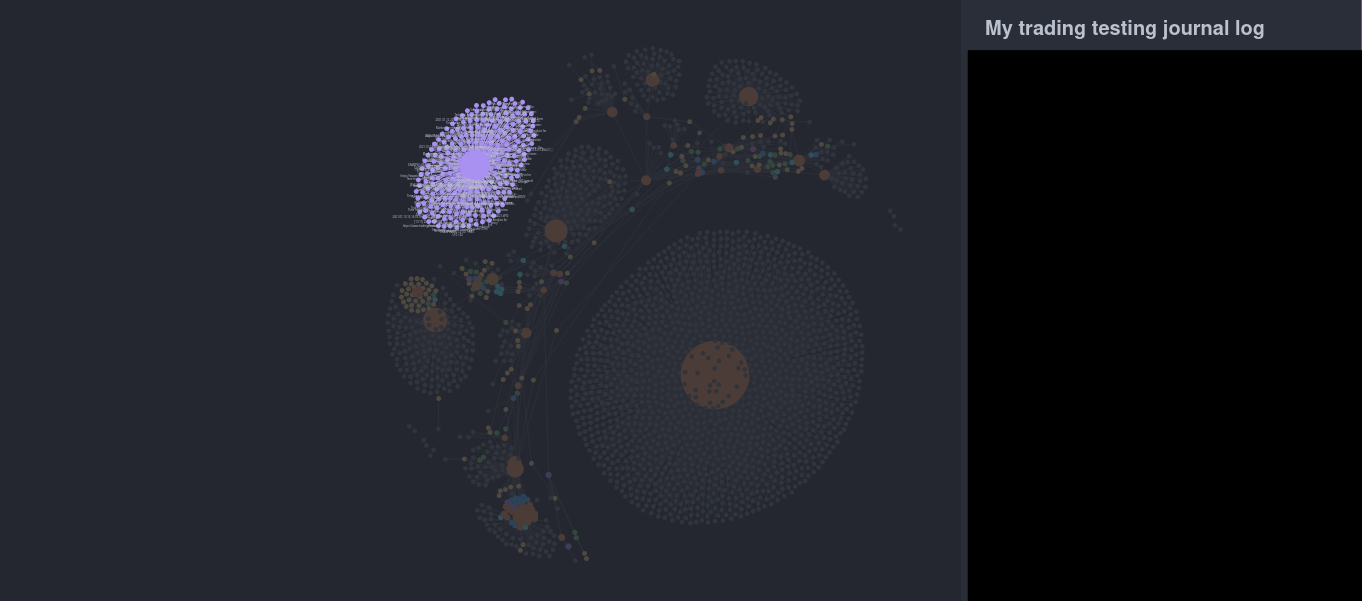
Figure 6: Exobrain highlighting the testing version of my trading log (development purposes)
Figure 6 shows my simulated trading log. I integrated my own python tool with yasnippets, so Emacs could get all the goodies out of it. The result is a very detailed (and possibly overkill) simulated trade log. This is going to probably be decoupled from my org-roam database. I don’t really need to search on all of that.
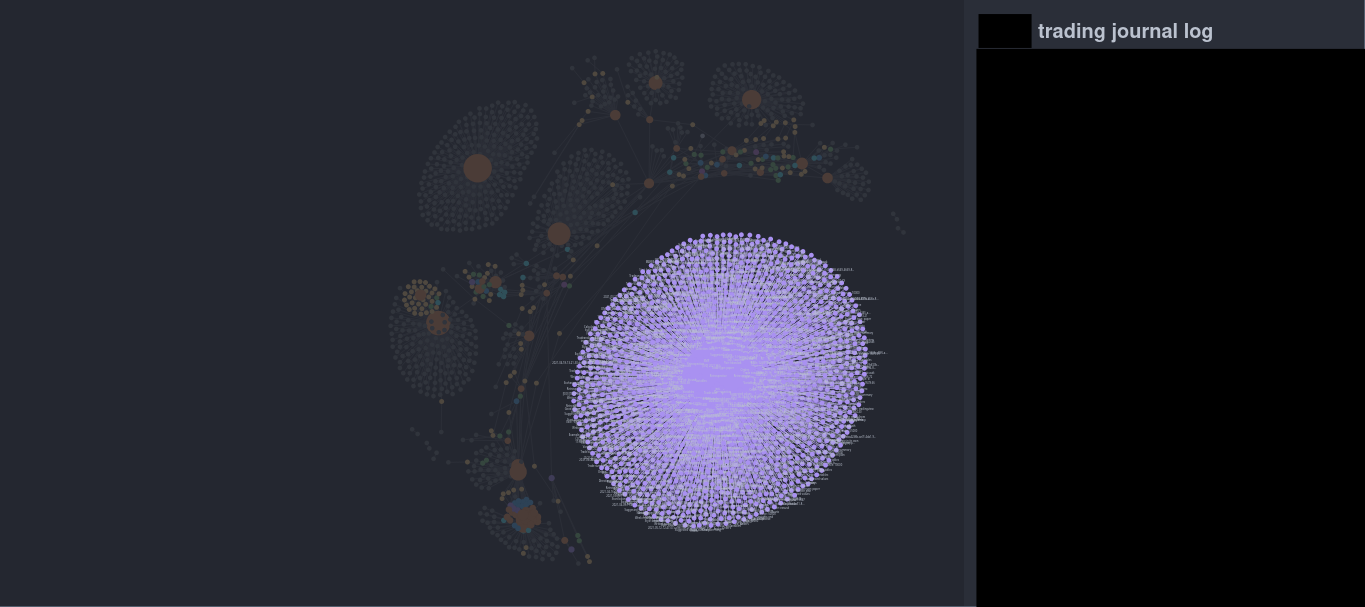
Figure 7: Exobrain highlighting my trading log
Figure 8 shows my research notes on automated trading strategies.
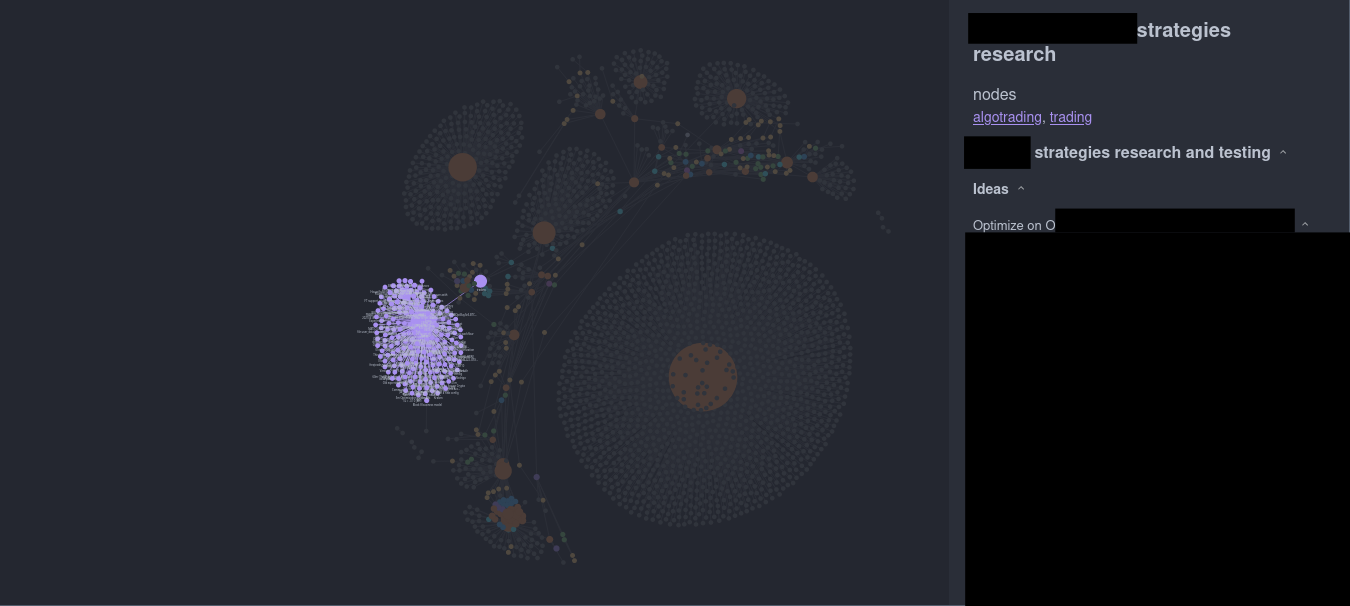
Figure 8: Exobrain highlighting my trading bots strategies and backtesting research
Figure 9 shows my research notes on agroforestry.
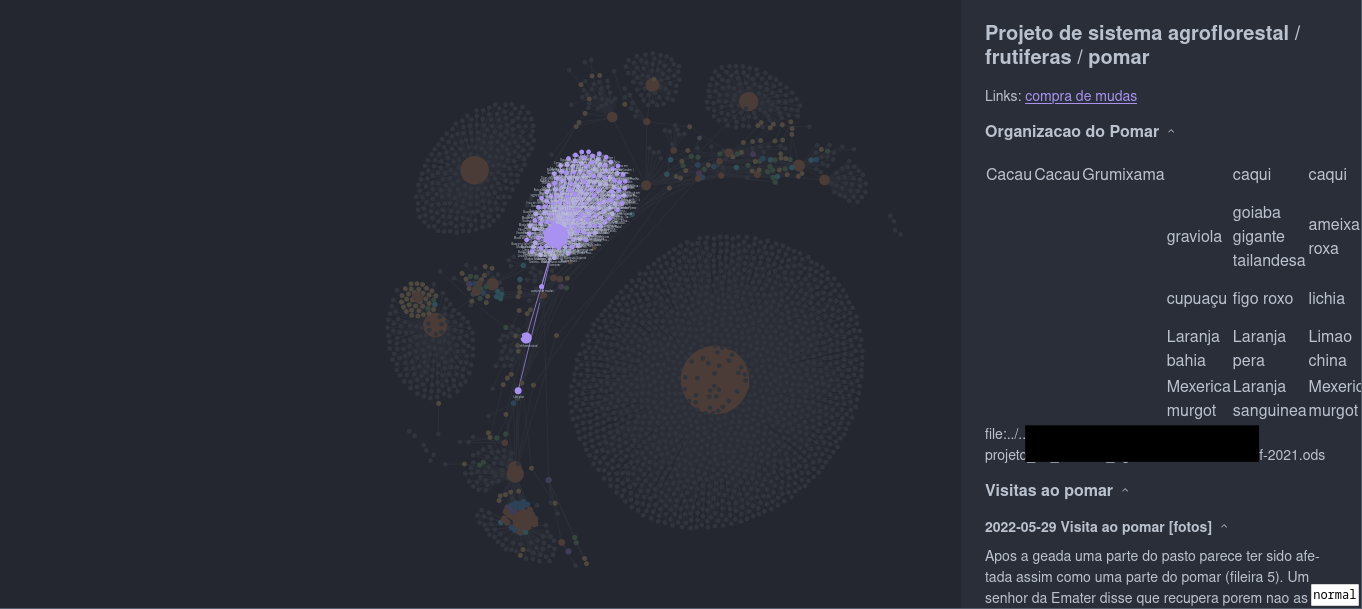
Figure 9: Exobrain highlighting the agroforestry notes, design and log
Figure 10 shows my journal of the current year 2022. TODO’s tasks and how they integrate with the rest of the notes.
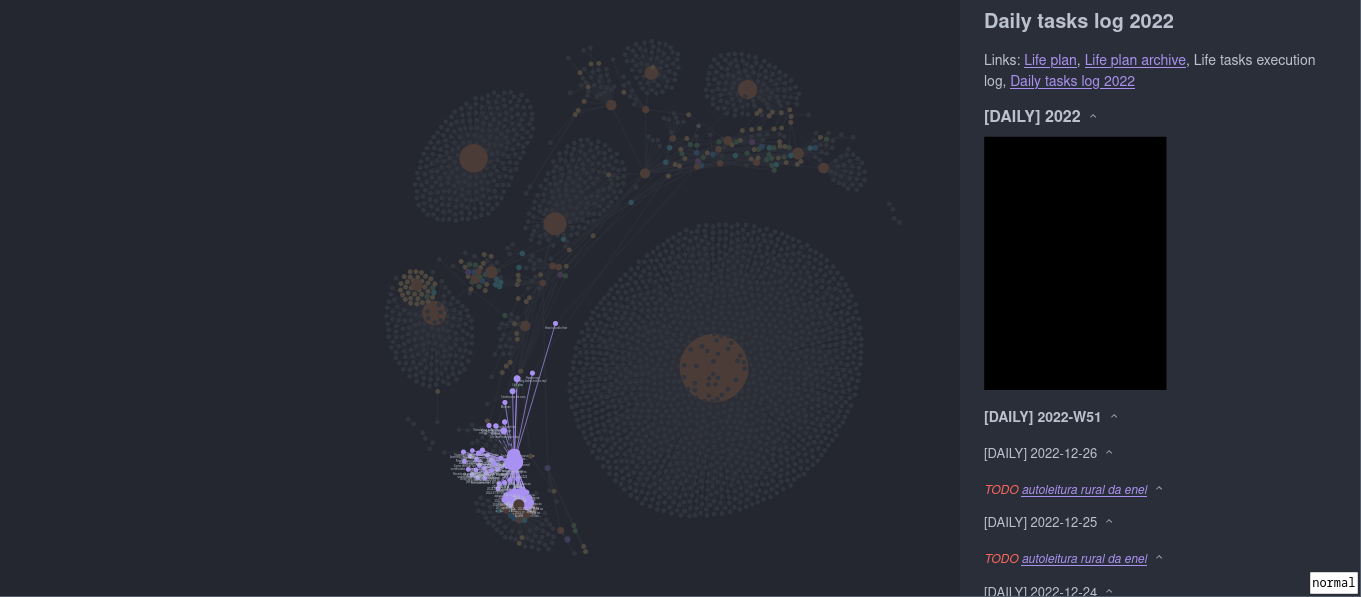
Figure 10: Exobrain highlighting the 2022 journal log
Figure 11 shows my homesteading notes and all the ongoing projects.
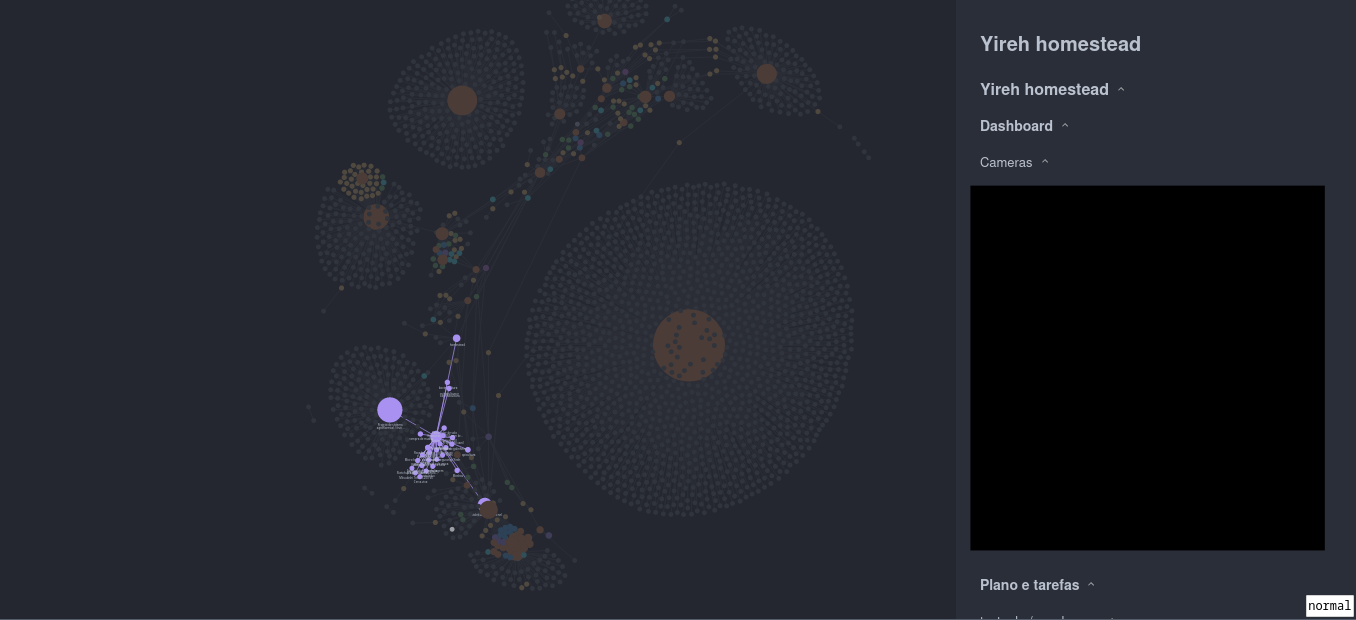
Figure 11: Exobrain highlighting the homestead related notes